|
The statistics and analysis from the valid survey we received ˇG |
| |
|
| ¤@ˇD |
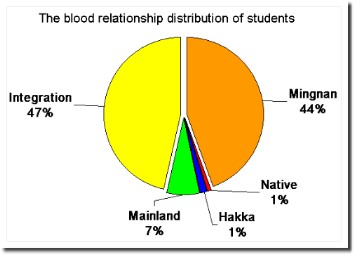
The blood relationship distribution of students ˇG |
| |
 |
| ¤GˇD |
The origin of integration of blood relationships
ˇG |
| |
|
| |
|
|
According the statistics data, we got some analysis ˇG |
| 1 ˇE |
The rate of integration is forty-seven percent. However, among those pure Chinese groups, about seven percent, it is quite common that their parents or grandparents came from different provinces. If this counts as integration, the rate should be higher than fifty percent.
|
| 2 ˇE |
Taipei city is the city where the Government located so the rate of Chinese group in the total population is higher than other cities. Because of this criterion, we know the integration rate should be lower than forty-seven percent in other cities. However, the rate of international brides is higher outside of Taipei . If we count this component, it will be hard to predict the rate of integration. This should be a topic for another project. |
| 3 ˇE |
The total number of integration is ninety-four people. Among those people, there are some combinations of the integration. The first combination consists of 75% MingNan and 25% Chinese and thirty-one people are in this group which is about 34%. The second one consists of 50% Chinese and 50% MingNan; seventeen people are in this group which is about 19%. The third group is 50% MingNan and 50% Hakka; fourteen people are in this group which takes 15%. The rest combinations are lower than 10%. |
| 4 ˇE |
People used to said the population of Taiwan consists of 75% MingNan, 13% ~ 14% Hakka, 10% Chinese and 1% ~ 2% Native Taiwanese. From our statistics data, this say seems not correct.
|
|
In conclusion, we all live in this land. It is not necessary to distinguish which genetic group you are in and who came here first. We are the new generation of Taiwanese. |


