|
|
|
>>COD |
|
COD(Chemical
oxygen demand) is used for more quiet and clean river when BOD(Biochemical oxygen
demand) is for serious polluted water and industrial
wastewater. |
|
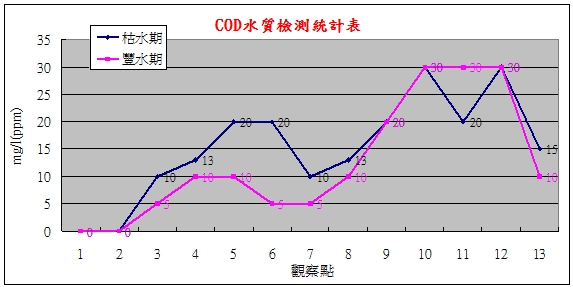
COD
Testing Result of Plum Tree Creek |
|
Observation
Point |
1 |
2 |
3 |
4 |
5 |
6 |
7 |
8 |
9 |
10 |
11 |
12 |
13 |
|
Low
Flow |
0 |
0 |
10 |
13 |
20 |
20 |
10 |
13 |
20 |
30 |
20 |
30 |
15 |
|
High
Flow |
0 |
0 |
5 |
10 |
10 |
5 |
5 |
10 |
20 |
30 |
30 |
30 |
10 |
|
|
COD
Statistical Chart of Plum Tree Creek |
|
 |
|
Analysis:
Origin-pollution
free
Headstream-moderate
pollution
Midstream-
mild polluted
Downstream-serious
polluted
The
difference of COD between slow and high flow is at
upstream area. During high flow, there is a significant
decline of COD at midstream area. |
|
Reference:
COD
& BOD.pdf |
|
 |
| Lower COD in origin, less pollution
|
 |
| A bit higher COD in midstream, moderate pollution
|
 |
| Highest COD in downstream, severe pollution
|
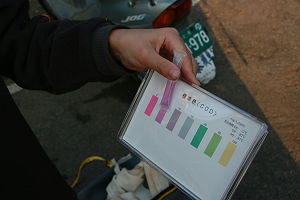 |
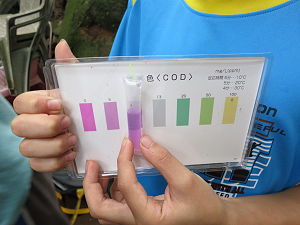
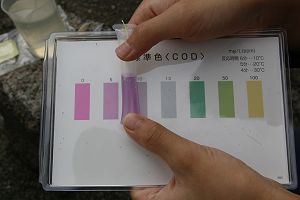
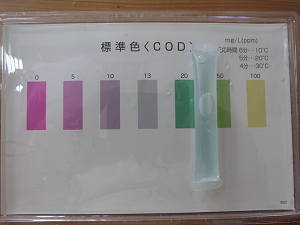
| Ratio on the color card
|
 |
| Color card
|
|