Introduction History Interview Ecosystem Pollution Water Testing Practical Action Prospect


>>The Overall Water Quality

The 
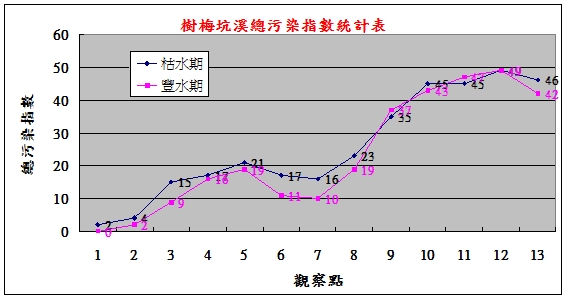
divided the degree of contamination into six levels. From 0 to 5, 0 represents non-polluted, the bigger the more serious. Therer are twelve elements so the total points will be sixty. Total points are clarified into seven levels:

0- unpolluted

1~8- extremely mild pollution

9~16- mild pollution

17~24- mild to moderate pollution

24~32- moderate pollution

32~40- moderate to severe pollution

Higher than 40- severe pollution

The Overall Water Quality of Our Testing Result

The Scorecard of Water Quality During Low Flow

    檢測點


檢驗的物質

1

2

3

4

5

6

7

8

9

10

11

12

13

NO3

0

1

1

1

1

1

2

1

2

4

5

5

4

NO2

0

0

2

2

2

1

1

1

3

5

4

4

4

COD

0

0

2

3

4

4

3

3

4

5

4

5

4

NH4

0

1

1

1

2

1

1

2

3

4

5

5

5

PO4

0

0

2

2

2

2

0

3

3

4

5

5

5

DO

0

0

1

1

2

1

1

1

3

5

5

5

5

PH

0

1

0

1

1

1

1

2

2

2

3

3

2

Water transparency

0

0

1

1

2

1

1

1

4

4

3

4

4

TDS

1

1

2

2

2

2

2

3

4

4

4

4

4

Water Turbidity

0

0

1

1

1

1

1

2

2

2

2

2

2

Heavy Metal

0

0

1

1

1

1

2

2

2

2

2

2

2

Conductivity

1

0

1

1

1

1

1

2

3

4

3

5

5

Overall

2

4

15

17

21

17

16

23

35

45

45

49

46

The Scorecard of Water Quality During High Flow

    檢測點


檢驗的物質

1

2

3

4

5

6

7

8

9

10

11

12

13

NO3

0

0

0

0

1

1

1

1

3

4

5

5

4

NO2

0

0

2

2

2

1

1

1

3

5

5

5

4

COD

0

0

1

2

2

1

1

2

5

5

5

5

2

NH4

0

0

1

2

2

1

1

1

3

4

5

5

4

PO4

0

0

1

2

2

1

1

2

2

4

5

5

5

DO

0

0

0

1

2

1

1

2

4

4

5

5

5

PH

0

1

0

1

1

1

1

2

2

2

3

3

2

Water transparency

0

0

1

1

2

1

1

1

4

4

3

4

4

TDS

0

1

1

2

2

1

1

2

4

4

4

4

4

Water Turbidity

0

0

1

1

1

1

1

2

2

2

2

2

2

Heavy Metal

0

0

1

1

1

1

0

1

2

2

2

2

2

Conductivity

0

0

0

1

1

0

0

2

3

3

3

4

4

Overall

0

2

9

16

19

11

10

19

37

43

47

49

42

The Statistic of Overall Water Quality

Analysis By the chart we can find the water quality is better during high flow than low flow at origin, headstream and midstream . It means that there are too much domestic sewage, the water quality couldn’t be improved even in high flow.

 
Unpolluted in origin
Unpolluted in downer area of origin
Mild pollution in the big pond of Xiao Pingding
Mild pollution in the farmland of Xiao Pingding
Mild pollution in the torrent of midstream
Moderate pollution in Shu Mei Keng No. 169
Severe pollution at the exit of culvert
Extremely polluted at the estuary
Severe Pollution at the estuary of Plum Tree Creek