.jpg "Open in new window")

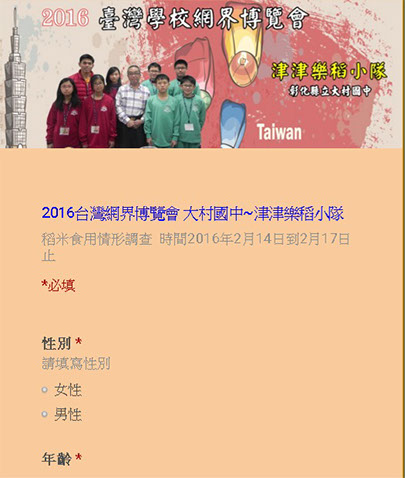
Our team use Google forms to create rice-eating form as questionnaires, using Facebook and LINE, invite all friends, and friends of friends, to help us fill in the questionnaire form. Survey from February 14, 2016 until February 17. Questionnaire number 162
Results the following table:
1.Number of girls and boys
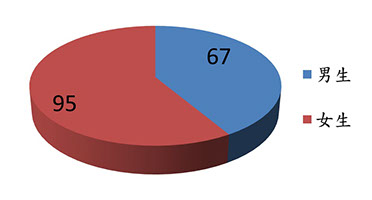
Boys
Girls
Questionnaire data reference
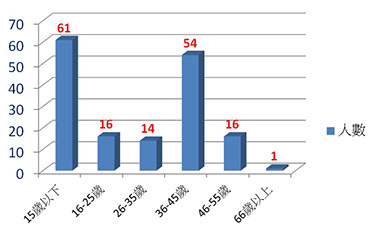
2.Age distribution
3.Living area distribution
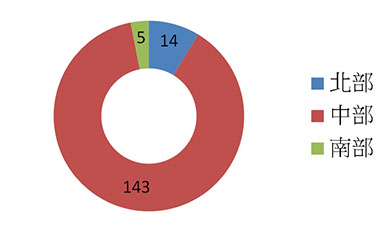
North
Central
South
Analysis: the data show 15 most because our team member's friends were in this age group. Is 36-45 again in this age group, this thanks to the parents of the students supported the activities of our team.
Analysis: the data show most of Central, because our school is in the Middle, so size is definitely in the middle of the most. Also very grateful to the North and South of the friends to support our activities.
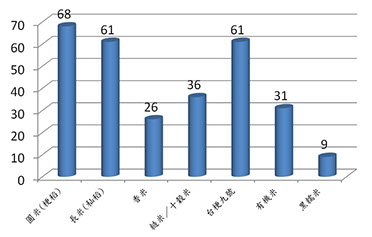
4.What kind do you usually eat rice?
5.Procurement will consider the following factors
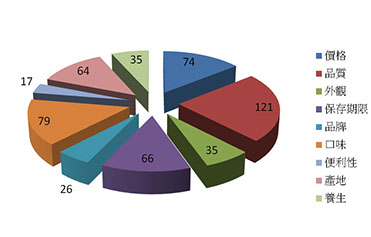
Cost
Quality
Appearance
Retention age
Brand
Taste
Convenience
Origin
Health
Analysis: the data shows that Jing with Indica rice together accounted for the most people, our team discussed and think it should be below the age of 15 accounted for 61, and all they see is Jing rice to Indica rice, so this result.
Analysis: graph data displayed on meter quality and most people care about, is the taste and price. Shelf life though came in last, but we still think it's important, general market sell bulk meters, did not fill out the Save term, probably for this reason, so considerations project came in fourth. Fifth is the origin, contaminated with heavy metals such as cadmium rice rice is often heard before, so we will focus on projects.
The data source
Changhua County Dacun junior high school, Taiwan.
(For best browsing experience: 1280*1024.)
