|
Questionnaires for volunteers (the library CEO)
1.The Process
•Giving out 25 copies of questionnaire
and retrieving 20 out of them
•Verifying the retrieved questionnaires
•Gathering the statics
•Analyzing the results
•Explaining the results
2.The Analysis of the results
1) Gender of the interviewees
|
Gender
|
Female
|
Male
|
|
number
|
19
|
1
|
|
percentage
|
95%
|
5%
|
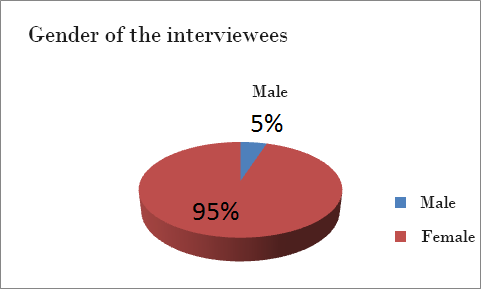
Analysis:
We learned that female volunteers
are more than male due to the family supporters’
backgrounds. In most family, male
go out to work while female take care the
housework and children, so more female have
time to volunteer for the library than male
do.
2) Work Status
|
Work Status
|
housewife
|
retired
|
On the job
|
|
Number
|
16
|
2
|
2
|
|
percentage
|
80%
|
10%
|
10%
|
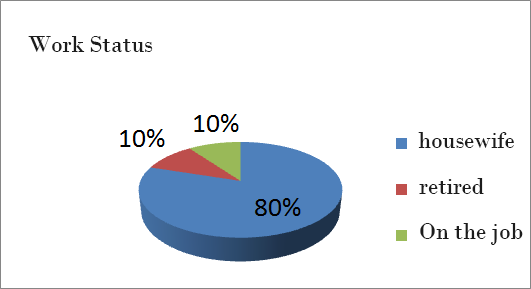
Analysis:
Most of the volunteers are housewives
and while the others are the retired and
people still on their job. It’s because
housewives are more flexible.
3) Age
|
Age
|
30-39
|
40-49
|
50-59
|
60 & above
|
|
Number
|
2
|
14
|
2
|
2
|
|
percentage
|
10%
|
70%
|
10%
|
10%
|
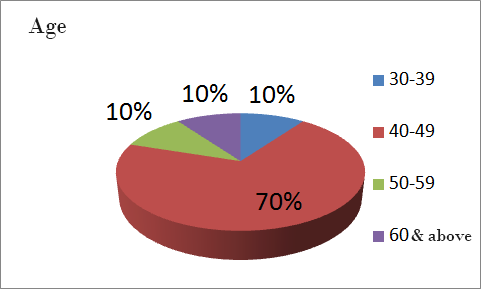
Analysis:
Most volunteers are aged from 40
to 49. What is more special is that
there are two grandparents who are more
than 60 year old.
4) Motive for being a volunteer(multiple options )
|
|
Child or grandchild studying
at this school
|
Self-actualizing
|
Friend’s
invitation
|
Others
|
|
Number
|
14
|
9
|
2
|
2
|
|
Percentage
|
52%
|
33%
|
7%
|
7%
|
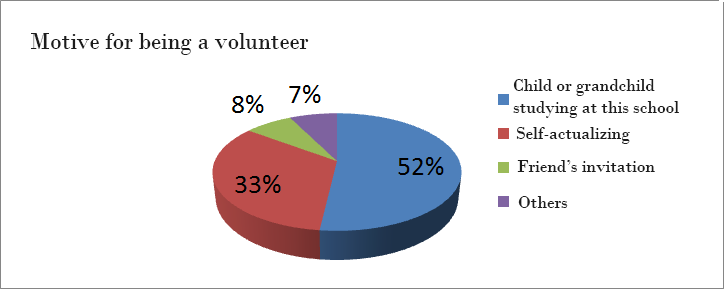
Analysis:
Having children studying at the school
is the most common motive for the volunteers.
Self-actualizing is the next. While friend’s
invitation is the least.
5) Also volunteering for other groups (multiple option)
|
|
Story-telling
|
Traffic-guard
|
Consulting
|
None
|
|
Number
|
3
|
8
|
7
|
7
|
|
Percentage
|
12%
|
32%
|
28%
|
28%
|
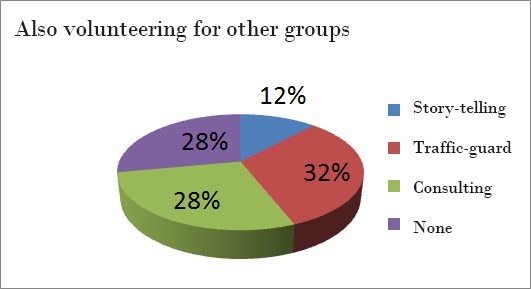
Analysis:
65% of the volunteers also volunteer
for other groups. Most of them even
volunteer for more than two groups. Traffic-guard
and consulting are most popular among these
overlapped groups.
6) Having or used to have children studying at this school
|
|
Having now
|
Used to have
|
|
Number
|
12
|
8
|
|
Percentage
|
60%
|
40%
|
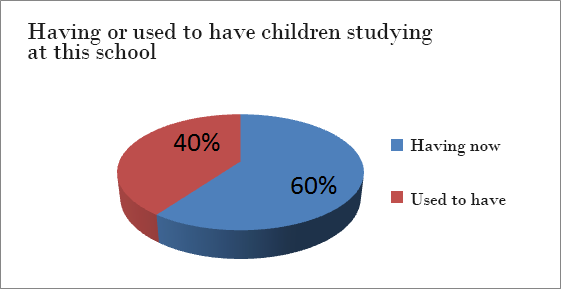
Analysis:
Most of the volunteers are still
having their children studying at the school
now. Only 40% of them used to have
children studying at the school.
7) Grades of their children:
|
|
Kindergarten
|
grade
1
|
grade
2
|
grade
3
|
grade
4
|
grade
5
|
grade
6
|
|
Number
|
1
|
2
|
0
|
2
|
2
|
2
|
3
|
|
Percentage
|
12%
|
10%
|
0%
|
10%
|
10%
|
10%
|
15%
|
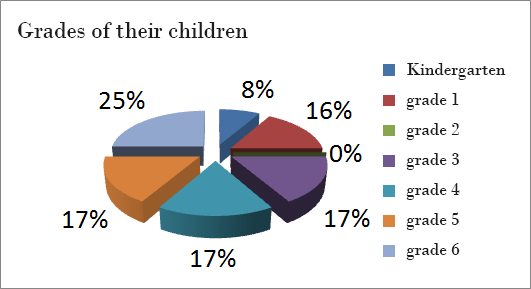
Analysis:
Except for third graders, volunteers
are the parents from all other graders.
8、Will you keep volunteering in the coming years?
|
|
Yes
|
No
|
|
Number
|
16
|
4
|
|
Percentage
|
80%
|
20%
|
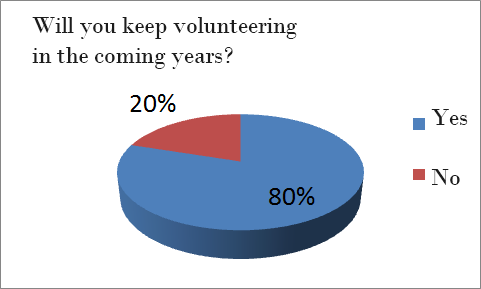
Analysis:
Four people out of the twenty said
that they won’t keep being the volunteer
after their children graduate. It
means we have to aware the possible shortage
of the volunteers.
9) Equipments the volunteers concern more
|
|
books
|
Computers&
Internet
|
Others
|
|
Number
|
7
|
5
|
3
|
|
Percentage
|
47%
|
33%
|
20%
|
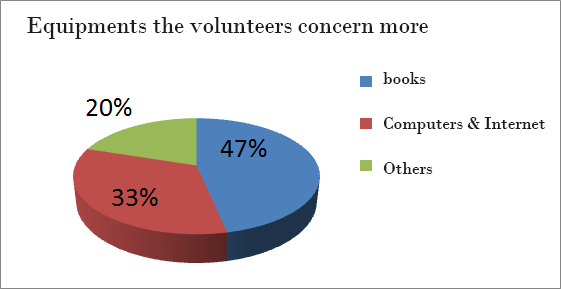
Analysis:
More volunteers concern about the
books. They hope the library can speed
up the updating of new released books. While
some volunteers hope the librarian system
and related sources can be more efficient.
10) Personnel the volunteers concern more
|
|
Volunteer
librarians
|
The Faculty
|
Students
|
|
Number
|
8
|
10
|
4
|
|
Percentage
|
36%
|
46%
|
18%
|
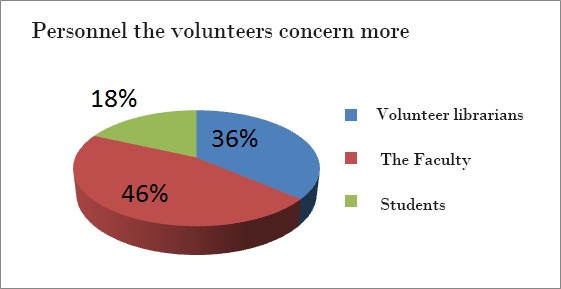
Analysis:
The volunteers have more expectations
from the faculty since they hope teachers
can put the education about using libraries
into effect.
Conclusions
From above, we know that female volunteers
are more than male and most of them have
children studying in all different grades
now. Besides, they have some suggestions
about the use of libraries. Therefore,
our project team decide to promote the use
of libraries in the classes.
| 


 Home Page | Project Narrative | Xisong Elementary School | Site Map