


1. Questionnaire formulation process:
In our three tutors, one is doctor and the other two are masters. They often shared with us their learning and researching experience, to benefit us a lot. They guided us some key points of questionnaire planning and survey, to make our survey more representative. As our capacity is limited, our teachers told us not to make the questionnaire too difficult or design too many questions, for it would increase the difficulty in data analysis, and also we were told to consider the feeling of those filling the questionnaire, for those to be surveyed would have no patience to fill in, so we were required to design ten questions at most, including at most of two basic items. Therefore, after discussion and screening by teachers, we designed ten questions. In addition, to understand the opinions of those of different genders and ages, we designed to make the answers to tick their gender and age in the basic items.
 |
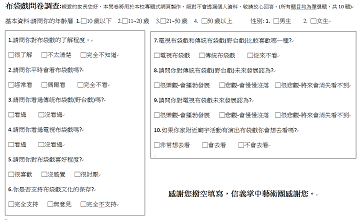 |
| We designed the questions to be discussed into questionnaire with Word. | The questionnaire we designed. |
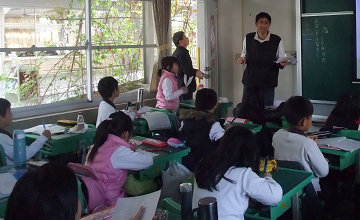
2. Questionnaire test process:
We school has junior school students and primary school students, so we sampled six classes (one class respectively from grades 7 and 8 of Junior School Department and one class respectively from grades 3, 4, 5 and 6 of Primary School Department), sent 50 pieces of questionnaires to each class, totaling 300 pieces. Among these questionnaires, some were filled in by the students, and some were taken by them to their houses to be filled in by their family members. Under the assistance of tutor of each class, we took back the questionnaires smoothly. However, although the questionnaires we distributed were taken back in full, yet 30 ones were filled in blindly or had omits of data. Our tutors asked us to cancel these 30 ones and other 270 ones would be used for data analysis.
 |
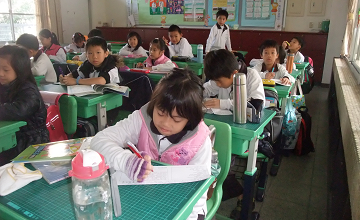 |
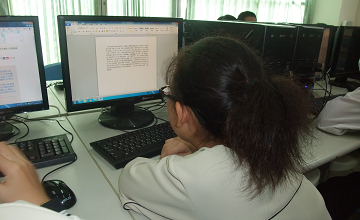
| As for the questionnaire we designed, the teachers explained the questions to the primary school students to avoid their answering wrongly. | The primary school students’ survey conditions. |
3. Questionnaire analysis process:
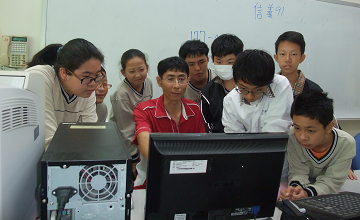
As we had learned Excel in the computer class, our tutors guided us to make data statistics with Excel and made the data into statistical chart (pie chart).
 |
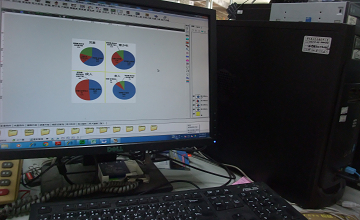 |
| We were guided to make the statistical data into statistical chart. | At last, the statistical chart was cut or combined into the one of the size we need with Photocap. |
4. Results and Discussion:
We discovered from and felt surprised at the analysis results a lot. Thus, after discussion of our project members, we wrote our views into the conclusion and suggestion of this survey to be placed on the confidential page as the conclusion of this project.