※Hands-On Weather Study -- Satellite Cloud Image
Before teacher informs us about the Central Weather Bureau website, we rarely visit the site. There are many information on it such as:wind forecast, 7-day temperature, earthquakes, and meteorology encyclopedia...... She also mentions a glossary of meteorology terms:dew point, UV Index, heat index, etc. After all weather is not as easy as we thought!
|
|
|
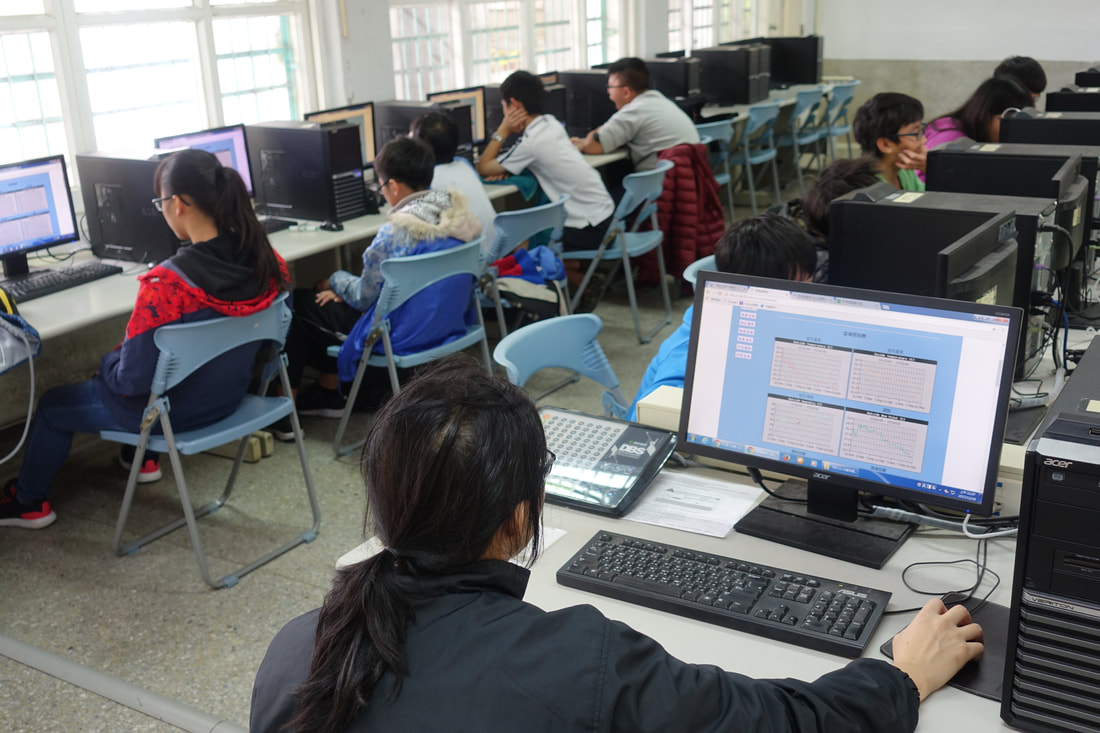
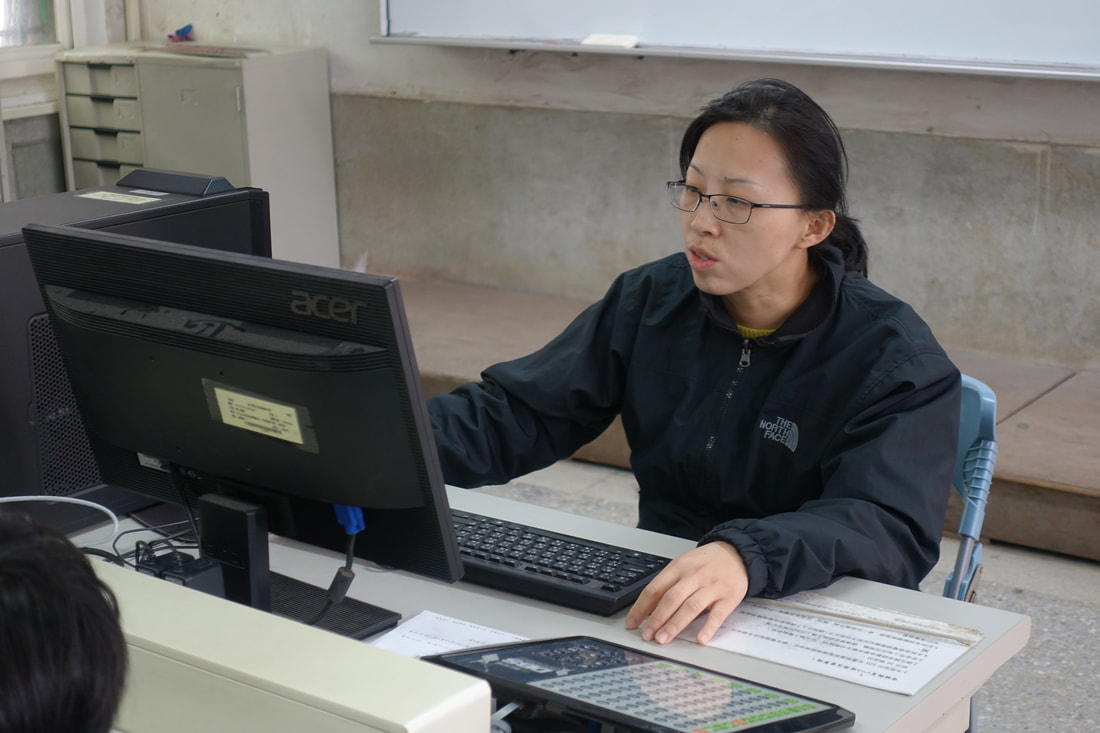
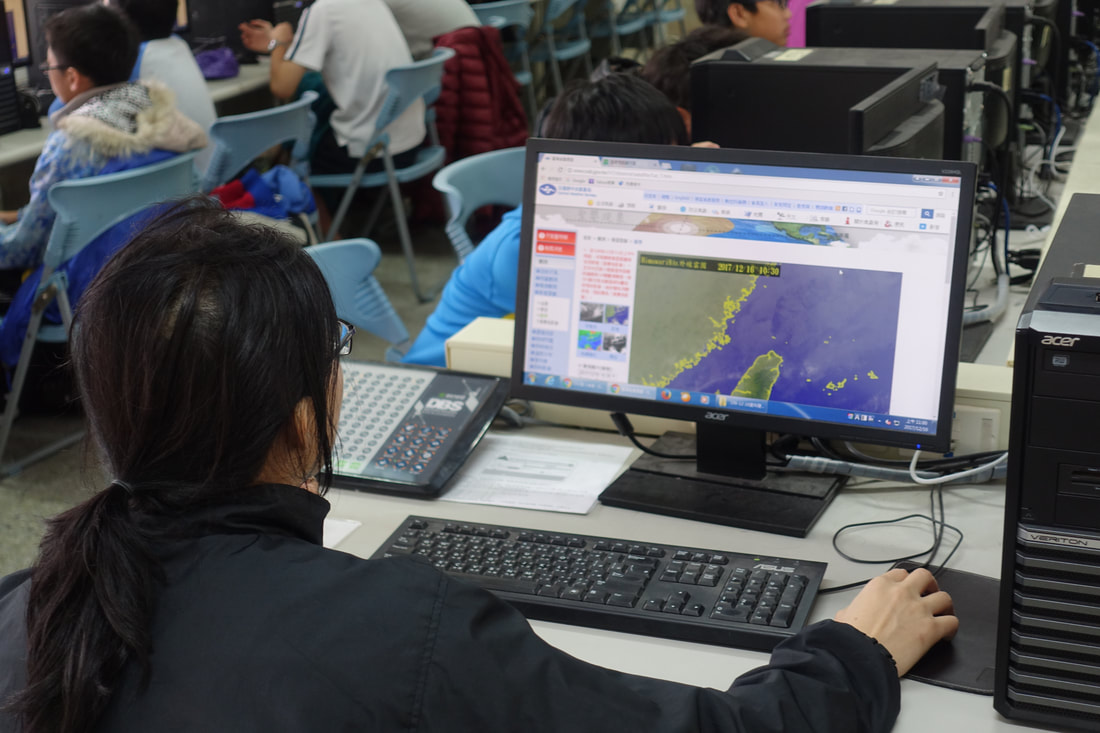
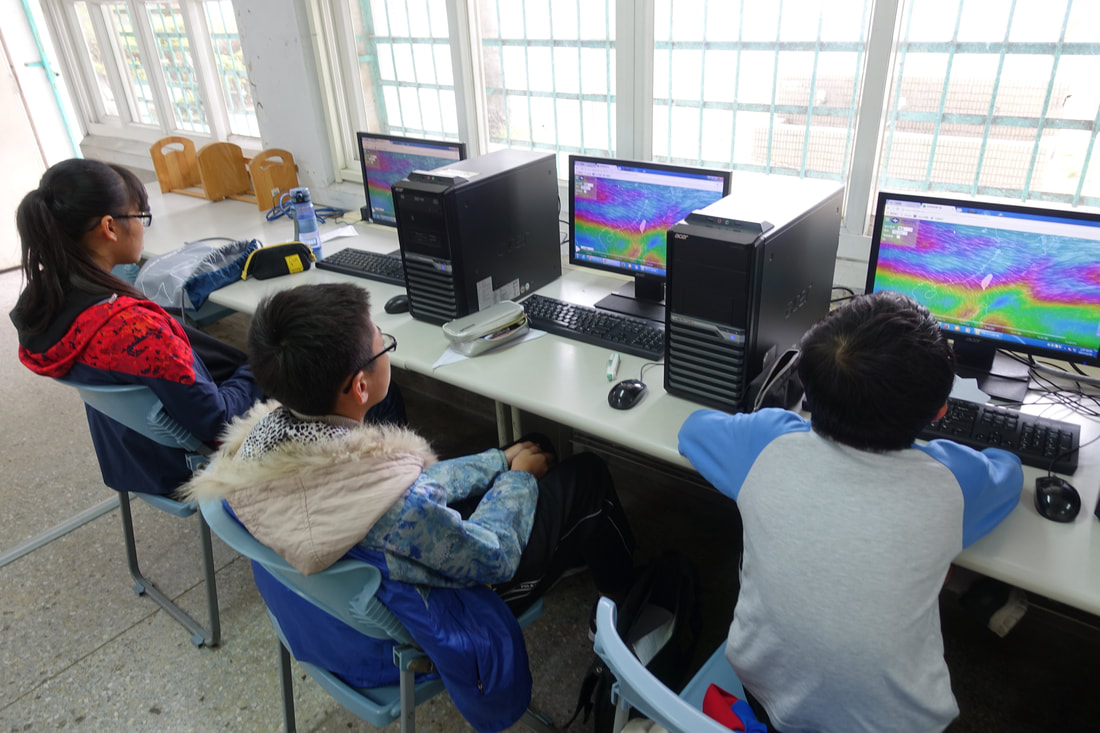
Miss Jia-Wen instructs us about Central Weather Bureau website
Satellite cloud image is an image based on data from meteorological satellite instruments. It captures the distribution of clouds in the atmosphere, to find the weather system and verify the correctness of surface weather maps that have been drawn. It can also be used with observations of sea ice distribution to determine the sea surface temperature and the medium-and long-term weather forecast oceanographic data. This technology can be a single image to show a variety of scales of weather phenomena to provide a very useful remote sensing data, weather analysis and forecasting.
|
|
|
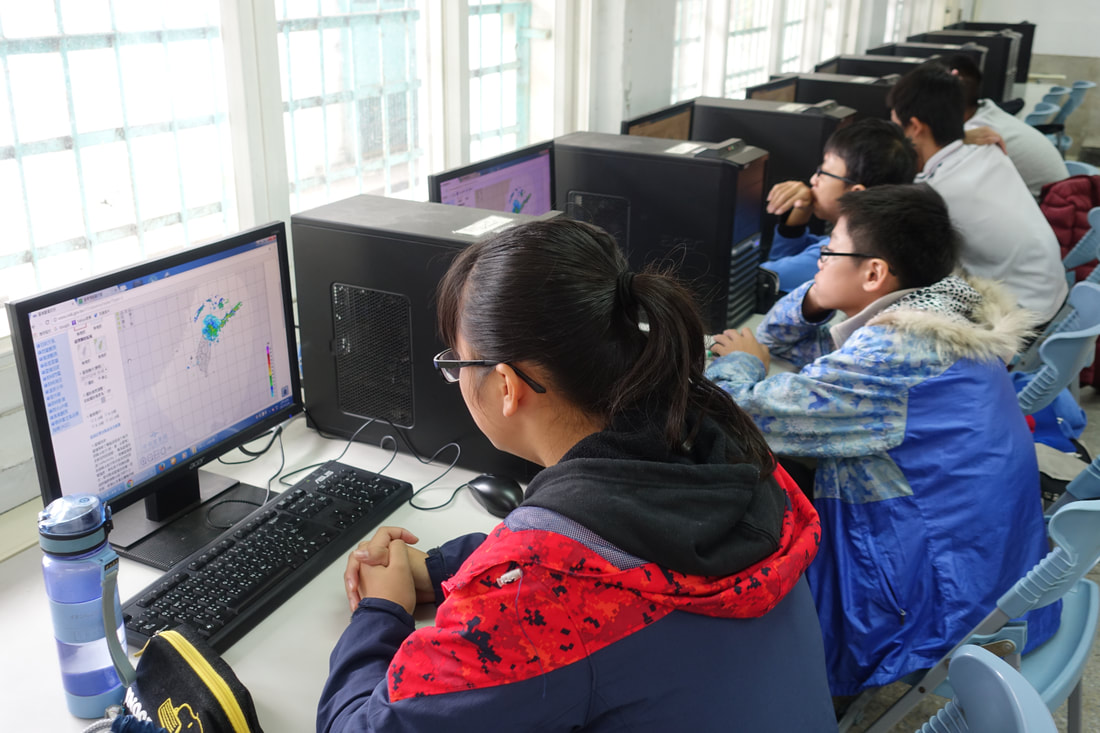
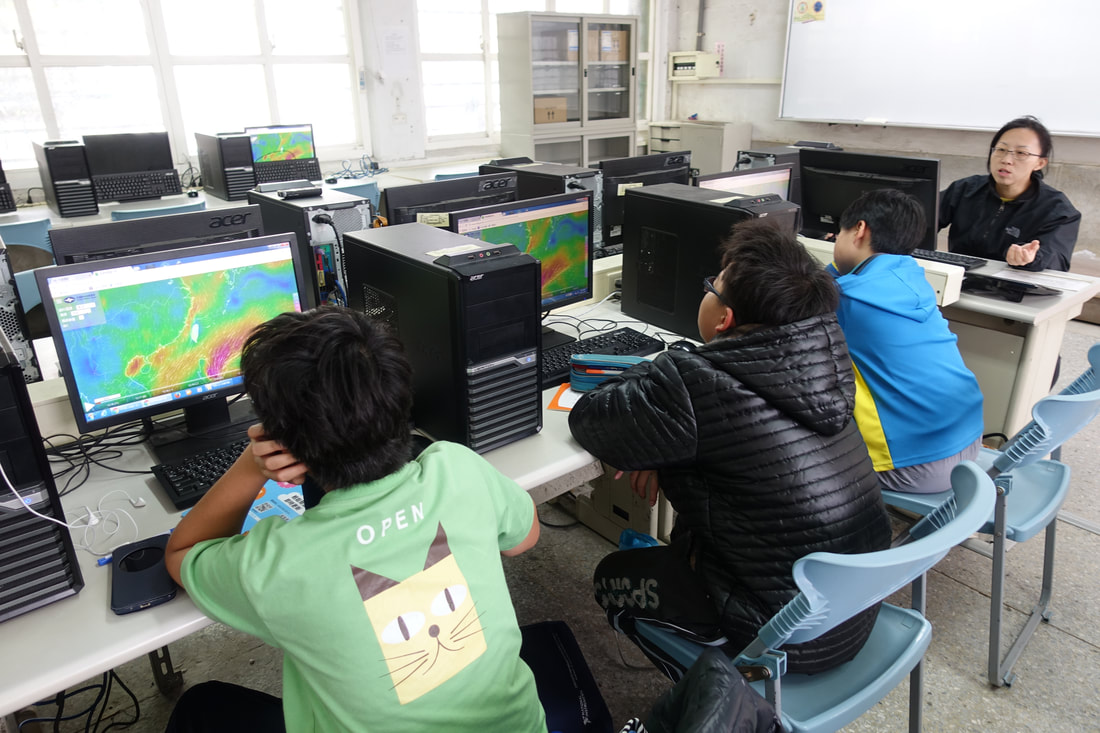
Team Pika learns about satellite cloud image from Miss Jia-Wen
The following are various meteorological satellite images Miss Wan Jia-Wen introduces to us(please click headings below)
※ Japan Meteorological Agency Infrared Satellite Cloud Image
The image below is infrared satellite cloud image from Japanese MTSAT-2 satellite IR1 channel, measuring unit is temperature (brightness). Lower temperature (brightness) means the higher the cloud tops. In short, different cloud-top temperatures represent different cloud-top heights. However, sunlight radiation and horizontal advection of temperature in high atmosphere can affect cloud-top temperature. Therefore, we should use external references to minimize errors when using infrared satellite cloud image.
The image below is infrared satellite cloud image from Japanese MTSAT-2 satellite IR1 channel, measuring unit is temperature (brightness). Lower temperature (brightness) means the higher the cloud tops. In short, different cloud-top temperatures represent different cloud-top heights. However, sunlight radiation and horizontal advection of temperature in high atmosphere can affect cloud-top temperature. Therefore, we should use external references to minimize errors when using infrared satellite cloud image.
JMA Infrared Satellite Image
※ Radar Reflectivity
The electromagnetic wave signal reflected by precipitation forms (rain, snow, hail, etc) in the atmosphere is called reflectivity. Based on different signal strength, radar reflectivity image is consisted of different colors. The strength of reflectivity is related to precipitation form’s size, shape, state and the number per unit. Generally speaking, the stronger the signal means stronger precipitation. Therefore, we can read about rainfall intensity and distribution on radar reflectivity image.
The image below is a composite reflectivity which Central Weather Bureau creates by using different reflectivity data from several places in Taiwan. The technical unit is dBZ. Higher dBZ means bad weather.
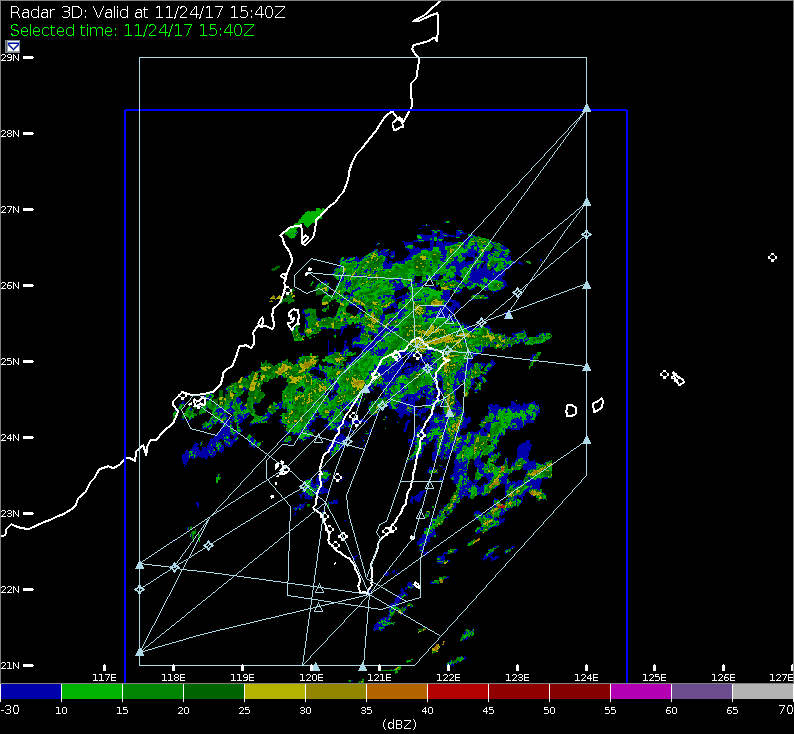
Central Weather Bureau Radar Reflectivity
※ Northwest Pacific Ocean Color Infrared Satellite Cloud Image
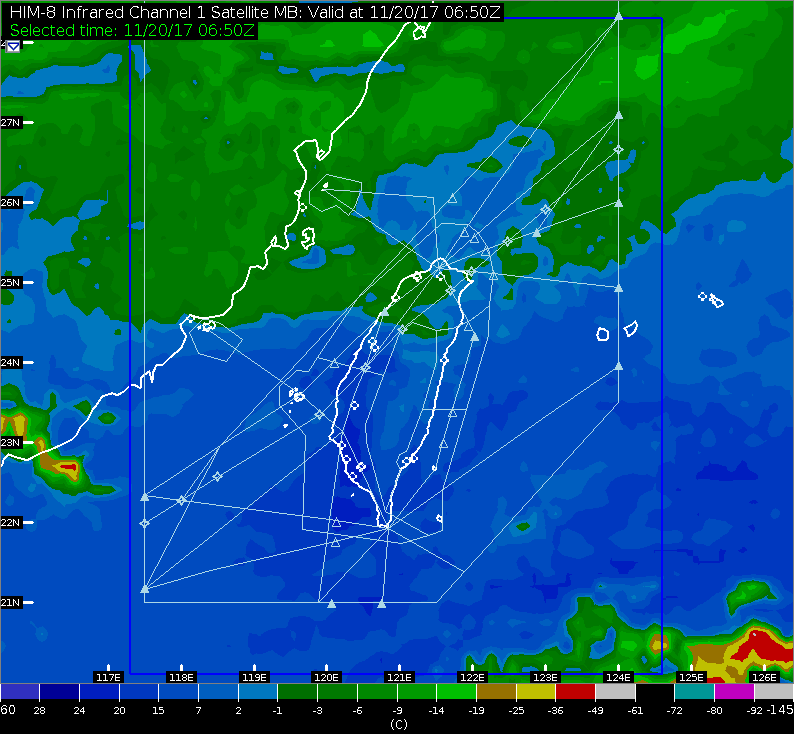
Infrared satellite cloud image uses infrared instrument on the satellite to determine the cloud temperature. Low temperature clouds are white, it means high altitude clouds. High temperature clouds are dark grey, it means low altitude clouds.
Himawari-8 is a new generation Japanese weather satellite. It greatly enhances the quality of satellite cloud image, improving on frequency, channel and image resolution. Comparing with MTSAT generation, 5 channel is expanded to 16 channel including 3 visible bands(can derive color images), 3 near-infrared bands, 10 infrared bands. In each 10-minute period, the AHI will scan the full disk once, and each 2.5 minutes will scan the Japan area and specific target(typhoon)once.
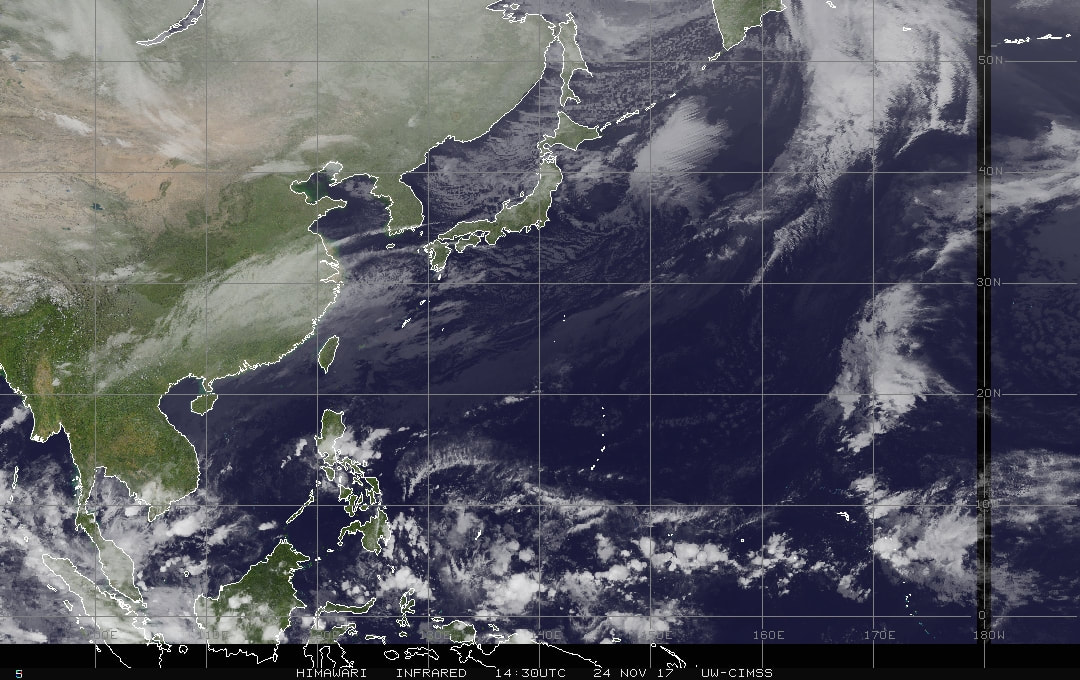
Northwest Pacific Ocean color infrared satellite cloud image
※ Surface analysis
The surface analysis weather forecast made by Hong Kong Observatory is based upon sea level. It is created by tracing the values of weather elements including wind direction, wind speed, temperature, humidity, atmospheric pressure, weather, cloud cover, etc. It can be used to analyze high pressure, low pressure, weather front and other weather systems.
The surface analysis weather forecast made by Hong Kong Observatory is based upon sea level. It is created by tracing the values of weather elements including wind direction, wind speed, temperature, humidity, atmospheric pressure, weather, cloud cover, etc. It can be used to analyze high pressure, low pressure, weather front and other weather systems.
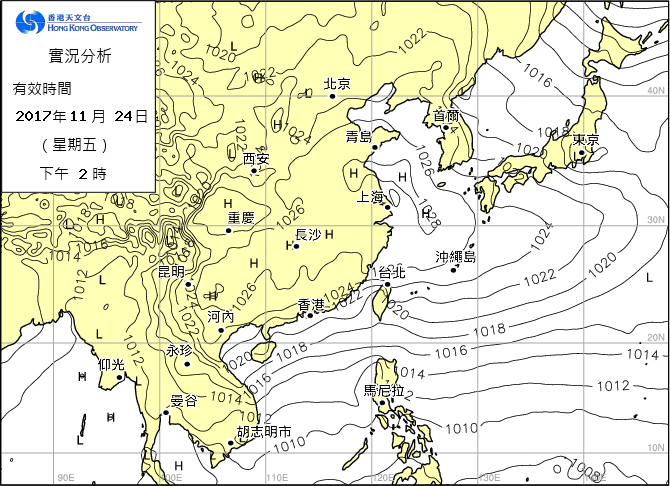
Surface Analysis
Writings:Team Pika, Wikipedia, Central Weather Bureau
Pictures:Team Pika, Central Weather Bureau
Pictures:Team Pika, Central Weather Bureau